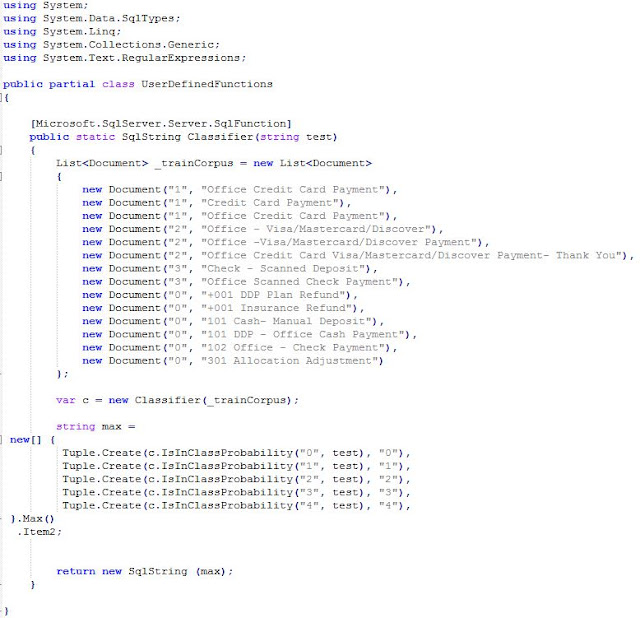
Building a ML classifier on dentistry payment plans data using C#

I prefer the Naive Bayes approach, because while having small set of data, it seems to make better decisions than I did in many cases. Also, the other type of classifier seems to do better on clear-cut cases, but doesn't seem to handle uncertainty so well. In addition,  the naive Bayes classifier corresponds to a linear classifier in a particular feature space.


                                                  Main Program
Text Pre-processing Class
 Naive Bayes Class

Comments

  1. Great information and thanks for sharing and Keep Going...I would also suggest for AI course with Real time experience, visit: https://socialprachar.com/artificial-intelligence-course-training-hyderabad/

    ReplyDelete

Post a Comment

Popular posts from this blog

Analyzing Net Promoter Score using Machine Learning

Overview This article presents a reference implementation of a Net Promoter score analysis project that is built by using Machine Learning. In this article, we will discuss associated generic models for holistically solving the problem of industrial Net Promoter score. We also measure the accuracy of models that are built by using Machine Learning and assess directions for further development. Net Promoter Score The Net Promoter Score is an index ranging from 0 to 10 that measures the customer’s loyalty to the brand. Calculation Customers are surveyed on one single question.  “On a scale of 0 to 10, how likely are you to recommend this company’s product or service to a friend or a colleague?” Based on their rating, customers are then classified into 3 categories: detractors, passives, and promoters. continue.......

SQL Table-Valued Function to Find the Best Trend Line Using Linear Regression

Linear regression is probably one of the first regression techniques we run across. It is useful for explaining (and perhaps forecasting) data that has a linear nature, but where the underlying process is unknown.  Linear regression line between New Patient Data and  Marketing Expenses   This solution focuses on the practical aspects of finding the best trend line for a financial time series using SQL function. If you have a large dataset with multiple sets of x and y data points associated with some attribute, you can do a linear regression on each set with one query using GroupID. The great strength of the linear regression line is that it can clarify sometimes ambiguous line charts and quantify the results via the slope of the line.

3D Medical Image Segmentation

This work is based on a Maximum a Posteriori (MAP) estimate of a log-likelihood function that accounts for the shape priori, the spatial interaction, and the current appearance of the tissues and its background (surrounding anatomical structures). Illustration of the Joint Markov-Gibbs random field (MGRF) image  model  Main references: Novel stochastic framework for accurate segmentation of prostate in dynamic contrast  enhanced MRI  International Workshop on Prostate Cancer Imaging, 121-130 A new 3D automatic segmentation framework for accurate segmentation of prostate from DCE-MRI  2011 IEEE International Symposium on Biomedical Imaging: From Nano to Macro